

Pilotiko feature : available
Revenue for a service business: definition, calculation and dashboard
A guide for service business owners who want to know exactly what they bill, track it every week on a small business dashboard and spot the levers for growth.
Revenue is the total of sales and services billed during a period, normally excluding sales taxes. For a service business, you calculate it from billed hours, flat-rate packages and parts resold, then track it every week on a revenue dashboard next to paid hours. A figure on its own says little; compared, it says a lot.
30 days free, no credit card.
In short
- Net revenue = sales and services for the period, excluding the GST and QST collected on behalf of governments.
- For a service business, revenue's best companion is hours: revenue per paid hour and the share of hours billed.
- A useful dashboard fits on one screen: 5 to 7 indicators, a fixed period, and a comparison with the same period last year.
- The most direct levers are often internal: fewer gaps in the schedule, fewer no-shows, and quotes that get followed up.
What is revenue for a service business?
It is the total of what the business sold and billed in services over a given period: a month, a quarter, a fiscal year. It measures activity, not profit.
The OQLF accounting vocabulary defines revenue (chiffre d'affaires in French) as the sum of sales and services provided by a business over a period, with sales, sales revenue and revenues as English equivalents. It distinguishes gross revenue, which includes recoverable taxes, from net revenue, which excludes them; unless stated otherwise, the income statement shows the net figure [1].
In a service business, services dominate. A plumber, a physiotherapy clinic or a cleaning company mostly sells hours and packages. Parts or products resold add to that, but they rarely weigh the most. The glossary covers the term on the page Revenue.
Revenue is not cash in the bank. An invoice issued on the 28th counts in that month's revenue, even if the customer pays 30 days later. That is why you track it next to cash receipts, never instead of them.
How do you calculate revenue for a service business?
For the period, add billed hours multiplied by their rate, packages sold and parts resold, all before taxes. Subtract credits and refunds granted.
The formula fits on one line: revenue = (billed hours × hourly rate) + packages + parts and products resold − credits granted. What matters is discipline: one source for invoices, a fixed period, and taxes always set aside.
Should GST and QST be included in revenue?
Not in net revenue. Taxes collected belong to governments: they pass through your account but do not measure your activity.
On a $1,000 service invoice in Quebec, the 5% GST adds $50 [2], and QST is added as well. The customer pays more than $1,000, but your net revenue stays at $1,000. Mixing the two inflates your figures and skews any comparison with a month where taxes were removed.
Revenue also tells you whether you must collect GST/HST. According to the Canada Revenue Agency, you remain a small supplier as long as your taxable supplies do not exceed $30,000 in a single calendar quarter or over four consecutive calendar quarters [3]. A growing business should check that threshold every quarter.
Revenue, profit and cash: what is the difference?
Revenue measures what is billed, profit what is left after expenses, and cash receipts what actually reached the bank. The three are tracked together.
| Measure | What it counts | Question it answers | Common trap |
|---|---|---|---|
| Net revenue | Sales and services billed, excluding taxes | How much activity did I generate? | Leaving taxes in |
| Profit | Revenue minus wages, purchases, expenses and taxes | How much is left for me? | Assuming higher revenue means more profit |
| Cash receipts | Payments actually received | Can I pay my bills this month? | Forgetting overdue receivables |
Summary table proposed by Pilotiko, based on the OQLF's gross and net distinction [1].
How do you track revenue every week?
On a dashboard that shows the week's revenue next to hours, bookings and the same week last year. A lone figure says little; a compared figure says a lot.
The OQLF describes a dashboard as a visual display of the indicators managers need to follow activities and decide quickly, more concise than an operating report [4]. For a service business, that means one screen, not a twenty-tab workbook. See the glossary page Dashboard.
Each tile on the dashboard shows a key performance indicator, a measure used to assess progress toward an objective [5]. Choosing the indicators matters more than choosing the software. The table below is a starting point for a service business; the page KPI explains how to define your own.
| Indicator | Formula | Frequency | What it reveals |
|---|---|---|---|
| Net revenue for the period | Sum of invoices, excluding taxes | Weekly | Activity level |
| Revenue per paid hour | Revenue ÷ hours paid to the team | Weekly | Real productivity |
| Share of hours billed | Billed hours ÷ paid hours | Weekly | Time lost to travel, waiting and gaps |
| Revenue by service | Revenue for each type of service | Monthly | What really pays |
| Average amount per job | Revenue ÷ number of jobs | Monthly | Effect of packages and prices |
| Open quotes | Value of quotes with no answer | Weekly | Revenue sitting idle |
| Revenue vs last year | Revenue for the period ÷ same period a year earlier | Monthly | The trend, seasons included |
Selection proposed by Pilotiko. Keep 5 to 7 indicators; beyond that, nobody looks at them.
Business intelligence or a simple dashboard: what does a small business need?
A small service business first needs a reliable dashboard fed by its real data. Business intelligence, which is broader, becomes useful when several sources must be consolidated.
For what English calls business intelligence, the OQLF prefers the French term informatique décisionnelle and defines it by three actions: collecting, consolidating and analysing an organization's data to inform decisions [6]. The glossary page Business intelligence covers the vocabulary.
For a company of five to thirty people, the problem is almost never the power of the analysis tool. It is consolidation: bookings in a calendar, invoices in accounting software, quotes in an inbox. A revenue dashboard is only reliable if those sources refer to the same customer and the same period. The guide Service business software helps you choose a tool that connects them.
What does a weekly dashboard look like?
Five lines of figures, all calculated from the same invoices and the same timesheets. The example shows the calculations so you can redo yours.
How can a service business grow its revenue?
Start with the revenue you are already losing: paid hours not billed, no-shows, forgotten quotes, maintenance customers nobody called back. These levers need neither advertising nor new customers.
Before looking for new customers, look at the gap between paid hours and billed hours. It contains travel, waiting, gaps in the schedule and callbacks on the same job. Shrinking it, even a little, raises revenue without adding a single person.
No-shows are another visible hole. The guide Reduce no-shows shows how to put a figure on them. Unanswered quotes are revenue a customer has already asked for: a follow-up prepared every week is often worth more than a new campaign. For help from AI on those follow-ups, see AI for service businesses.
- Fill the gaps: group jobs by area to reduce time between customers.
- Follow up on quotes: a weekly list of unanswered quotes, with one person responsible.
- Sell recurring maintenance: an annual package turns a one-off customer into predictable revenue.
- Review prices once a year: compare revenue per paid hour with your real costs before deciding.
Which mistakes distort revenue tracking?
Leaving taxes in revenue, comparing months of different lengths, ignoring seasons and tracking revenue without hours. Each can suggest a rise or a drop that does not exist.
- Taxes included: revenue looks higher than it is, then drops the day you correct it.
- Uneven months: a month with 23 working days compares poorly with one of 20; bring it back to a per-day figure.
- Ignored seasons: a landscaper compares July with last July, not with November.
- Revenue without hours: rising revenue with many more paid hours can hide falling productivity.
- Two sources of truth: if the calendar and the books disagree, fix the gap first.
What does Pilotiko do to track revenue?
Pilotiko produces internal reports on bookings, revenue and workload, and shows key figures in the virtual office, from the company's real data.
In Pilotiko, reports and steering are available: bookings, revenue, team workload and indicators for each room of the virtual office. Every figure comes from the company's real data, filtered by the role of the person viewing it. An unknown value shows as a dash with its reason, rather than an invented number.
Frequently asked questions
What is a simple definition of revenue?
It is the total of sales and services billed during a period, such as a month or a year. It is usually shown without sales taxes. It measures the business's activity, not its profit.
How do you calculate revenue when you sell services?
Multiply billed hours by their rate, add packages and parts resold, then subtract credits granted. Do the calculation without GST or QST, over a fixed period.
Does revenue include sales tax?
Gross revenue includes it, net revenue does not. Net revenue is the figure used to track activity and the one shown on the income statement, unless stated otherwise.
How often should I track revenue?
Weekly to steer, monthly to compare with last year, quarterly for the GST small supplier threshold. One week is enough to spot a gap in the schedule before it costs a month.
What is a revenue dashboard?
It is a screen that shows revenue and the few indicators that explain it: billed hours, average amount per job, open quotes. It should be readable in a minute and update without re-entry.
Do I need business intelligence software as a small business?
Usually not at first. A dashboard fed by consolidated, reliable data answers most questions. Business intelligence tools become useful when several systems must be combined and analysed in depth.
Is revenue the same as profit?
No. Profit is what is left after wages, purchases, expenses and taxes. A business can grow its revenue and lose money if its costs rise faster.
Sources
- Office québécois de la langue française (Vitrine linguistique), chiffre d'affaires (GDT) (accessed on October 15, 2026).
- Canada Revenue Agency, GST/HST calculator (and rates) (accessed on October 15, 2026).
- Canada Revenue Agency, When to register for and start charging the GST/HST (accessed on October 15, 2026).
- Office québécois de la langue française (Vitrine linguistique), tableau de bord (GDT) (accessed on October 15, 2026).
- Office québécois de la langue française (Vitrine linguistique), indicateur clé de performance (GDT) (accessed on October 15, 2026).
- Office québécois de la langue française (Vitrine linguistique), informatique décisionnelle (GDT) (accessed on October 15, 2026).
Read next
- AI for small service businesses: assistants, agents and platformsAI assistant, AI agent or AI platform: what artificial intelligence really does for a small service business in Canada, the risks, and where to start.
- Service business software: CRM, ERP, SaaS or platform?CRM, ERP, SaaS or an operations platform: what each kind of small business software does for a service company in Canada, its limits, and how to choose.
- What is revenue, and how do you calculate it?What revenue means for a small business: sales and services for a period, gross versus net, a GST and QST example for a Quebec service company, common mix-ups.
- What is a management dashboard?What a management dashboard is, leading versus lagging indicators, how it differs from a report, a snow-removal example and mistakes that make it useless.
- What is a KPI (key performance indicator)?What a KPI is, how to derive one from a business goal, formulas for a service company, a worked month of numbers and the traps to avoid when picking them.
- What is business intelligence (BI)?What business intelligence means for a small service business: collecting, consolidating and analysing data, a margin-per-service example and common pitfalls.
Your whole business, on one screen.
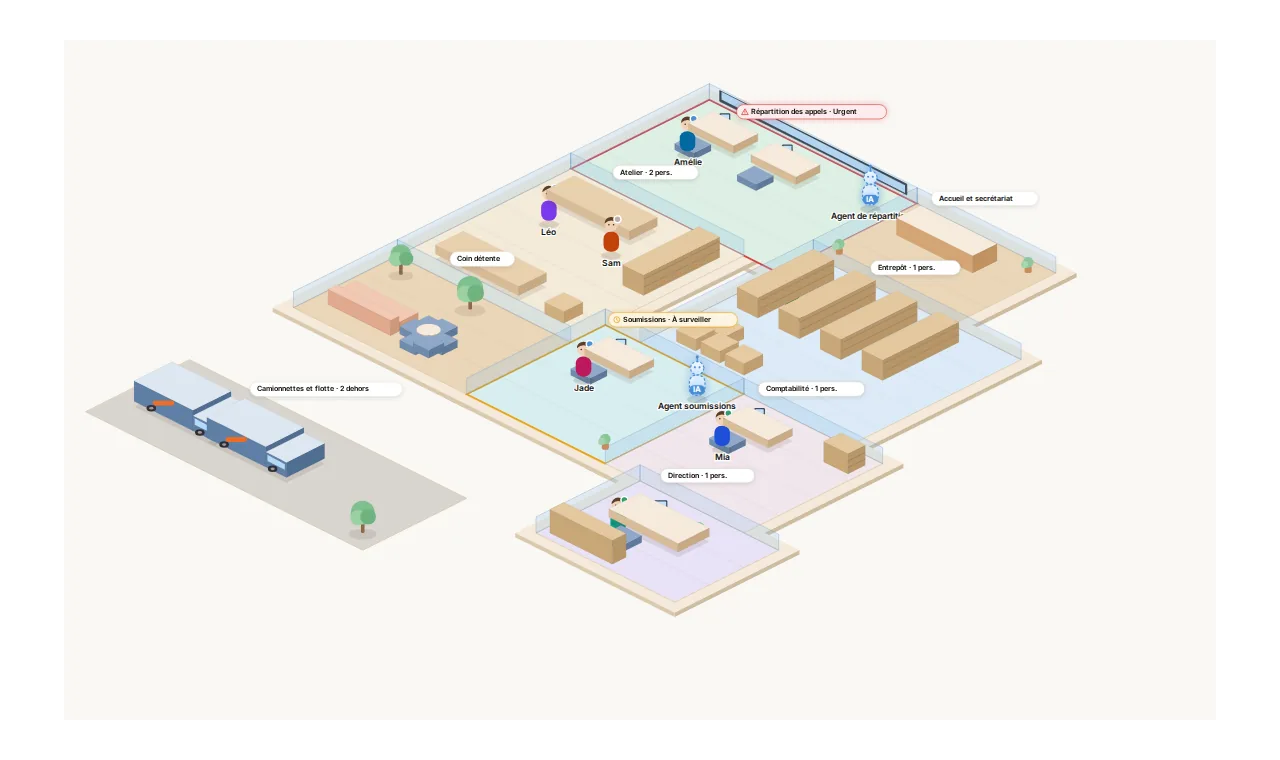
Each department is a room. Pilotiko prepares the work; you approve with one click.
- Call answered
- Appointment confirmed
- Email reply ready
- Invoice prepared