
Pilotiko feature : coming soon
Demand forecasting: how do you estimate the work coming in the next few weeks?
Knowing in March how many pool openings will land in May means hiring on time instead of turning customers away.
Demand forecasting is putting a number on how much work customers will ask for during a future period, such as a week or a season. It projects past data forward and factors in known drivers, like the calendar or the weather, so you can plan staff, equipment and purchases before the requests arrive.
30 days free, no credit card.
In short
- Quebec's OQLF separates forecasting, an objective projection of the past, from prediction, an intuitive judgment.
- Demand is easier to forecast when you understand its drivers, have data and the future looks like the past.
- The seasonal naïve method reuses last year's value for the same period: a solid starting point.
- In Pilotiko, service demand forecasting is planned and not offered yet.
What is the difference between a forecast and a prediction?
In its production planning and control domain, Quebec's Grand dictionnaire terminologique defines prediction as an intuitive assessment of demand that takes into account trends and changes likely to affect the market. The entry adds that prediction stands in contrast to forecast, which rests on an objective projection of the past into the future [1].
The distinction is handy in business. “I have a feeling summer will be busy” is a prediction. “Last May we did 64 openings; with the contracts already signed, we expect 68” is a forecast. Both have their place, but only the second one can be checked afterwards.
What makes demand more or less predictable?
The open textbook Forecasting: Principles and Practice, by Rob J. Hyndman and George Athanasopoulos, points out that forecasting supports decisions as different as building a power plant over the next five years and scheduling call-centre staff next week. It names four factors behind predictability: how well we understand what drives the quantity, how much data is available, how similar the future is to the past, and whether the forecast itself can change the thing being forecast [2].
For a service business, that translates simply. A snow removal company understands its main driver (snow) very well, but one winter rarely looks like the last. A physiotherapy clinic with a steady client base has regular data and demand that barely moves from week to week, so it is easier to forecast.
Which simple methods can a small business use?
The same textbook presents basic methods that serve as benchmarks and are sometimes surprisingly effective [3]. A small business can start there before reaching for a statistical model.
| Method | How it works | When to use it |
|---|---|---|
| Mean | Every forecast equals the average of past data | Stable demand with no trend or season |
| Naïve | The forecast equals the last observed value | Slowly changing demand, short horizon |
| Seasonal naïve | The forecast equals the value from the same season last year (e.g., last February for February) | Highly seasonal demand: pools, snow removal, air conditioning |
| Judgment (prediction) | The team's view of upcoming changes | New service, new territory, little history |
The first three methods come from section 5.2 of the textbook; the last row reflects the OQLF's notion of prediction.
What does a peak-season forecast look like in numbers?
How do you know whether a forecast was any good?
Write the forecast down before the period starts, then compare it with what actually happened. If the company in the example ends up doing 61 openings, the error is 7 openings, about 10% of the forecast (7 ÷ 68). Track that error season after season on your dashboard: if it always leans the same way, your method has a bias to fix.
A forecast doesn't need to be perfect to be useful. It needs to be close enough to support the right call: hire, rent a vehicle, order supplies or turn down a contract.
Which demand forecasting mistakes should you avoid?
- Treating past sales as true demand: requests turned away for lack of staff never show up in sales.
- Forecasting one number for the year instead of weeks or months, which hides the peaks.
- Ignoring known events: statutory holidays, March break, the start of snow season.
- Never comparing the forecast with actuals, so nothing is learned.
- Passing off a gut-feel prediction as a forecast when a hiring decision is on the line.
Does Pilotiko forecast service demand?
What is available: internal reports on bookings, revenue and workload per person. They give you the history a forecast needs, but projecting future demand is still up to you, for instance with the seasonal naïve method described above.
Frequently asked questions
What is the simplest forecasting method?
The naïve method: assume the next period will equal the last one. For seasonal work, the seasonal naïve version uses the same period last year instead. These methods are often used as a yardstick for judging more complex ones.
How much history do I need to forecast demand?
For seasonal demand, you need at least one full year, and ideally several, to see the same month repeat. For next week's forecast in a steady business, a few months of weekly data may be enough. The longer the history, the easier it is to spot unusual years.
Can weather be built into a forecast?
Yes, when it clearly drives demand, as with snow removal, air conditioning or pool care. Hyndman and Athanasopoulos use electricity demand, which depends heavily on temperature, as an example. The catch is that you then have to forecast the weather too, which gets shaky beyond a few days.
What is demand forecasting used for in a service business?
Mainly to adjust workforce planning and equipment purchases ahead of the peak. It also helps decide when to accept new contracts and when staff can take holidays. Without it, you find out you are short-staffed when customers are already waiting.
Does artificial intelligence forecast demand better?
Not automatically. A complex model only helps if it beats the simple methods on your own data, measured after the fact. For a small business with little history, a simple method tracked carefully is often a better start.
Sources
- Office québécois de la langue française, Grand dictionnaire terminologique, prédiction (accessed on October 15, 2026).
- Rob J. Hyndman et George Athanasopoulos, OTexts, Forecasting: Principles and Practice (3e éd.), chapitre 1 : What can be forecast? (accessed on October 15, 2026).
- Rob J. Hyndman et George Athanasopoulos, OTexts, Forecasting: Principles and Practice (3e éd.), section 5.2 : Some simple forecasting methods (accessed on October 15, 2026).
Read next
- What is a KPI (key performance indicator)?What a KPI is, how to derive one from a business goal, formulas for a service company, a worked month of numbers and the traps to avoid when picking them.
- What is business intelligence (BI)?What business intelligence means for a small service business: collecting, consolidating and analysing data, a margin-per-service example and common pitfalls.
- What is a management dashboard?What a management dashboard is, leading versus lagging indicators, how it differs from a report, a snow-removal example and mistakes that make it useless.
- Workforce planning: how do you get the right people at the right time?Workforce planning for a Quebec service business: time horizons, CNESST scheduling rules, vacation timing and a peak-season calculation for a landscaper.
- Service capacity: how much work can your team really deliver?Service capacity for a service business: paid hours versus sellable hours, utilization rate, and a worked calculation for a four-person pool maintenance crew.
- Resource allocation: how do you divide people, equipment and hours?Resource allocation for a service business: people, vans, equipment and hours, with a worked weekly calculation and the mistakes worth avoiding.
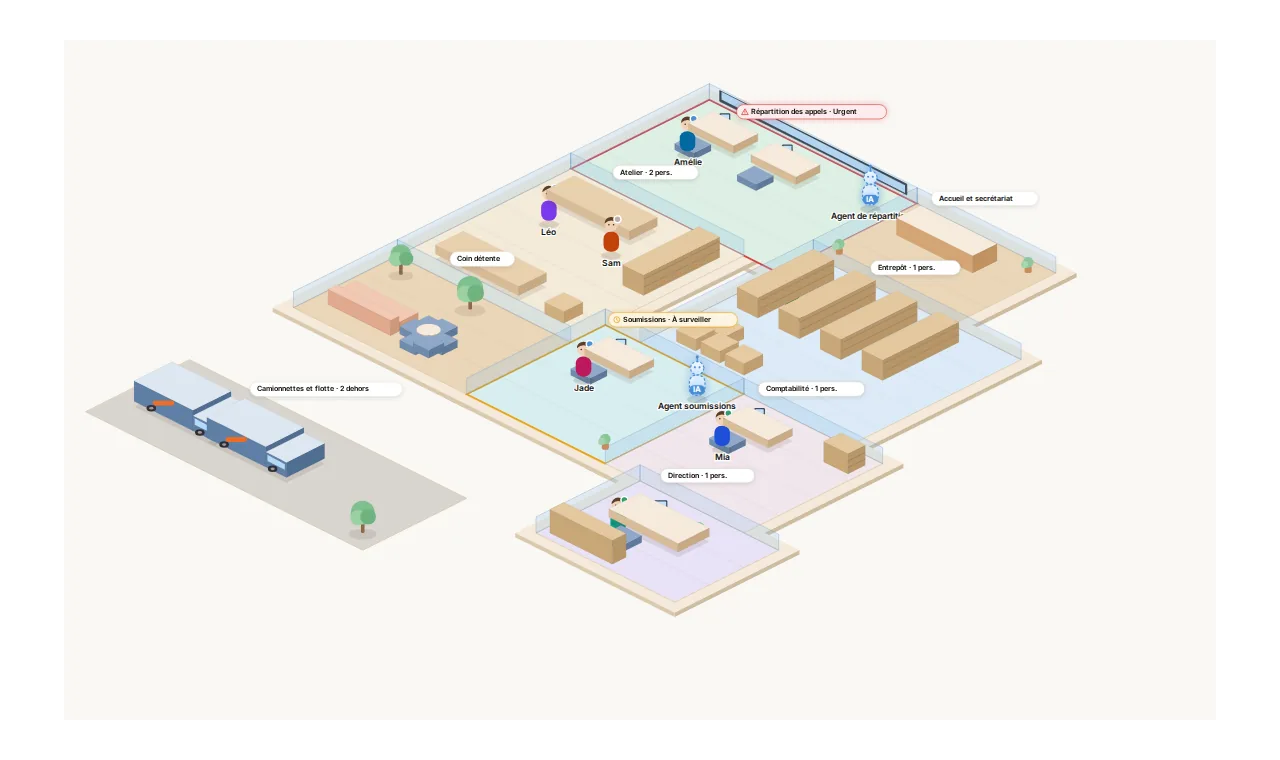
Your whole business, on one screen.
Each department is a room. Pilotiko prepares the work; you approve with one click.
- Call answered
- Appointment confirmed
- Email reply ready
- Invoice prepared